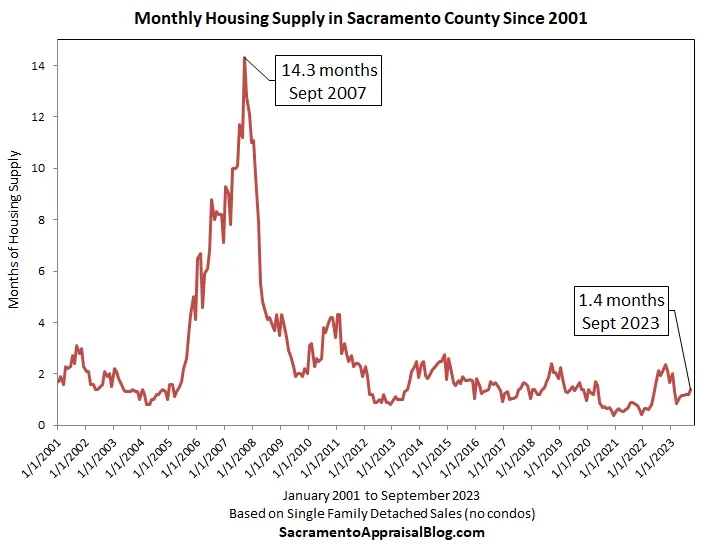
Ten times more housing supply!!! That’s what 2007 had compared to right now. Today I want to share a stunning supply visual for Sacramento, and talk briefly about what’s happening with sellers and prices. Enjoy if you wish.
TWO NEW MEMES
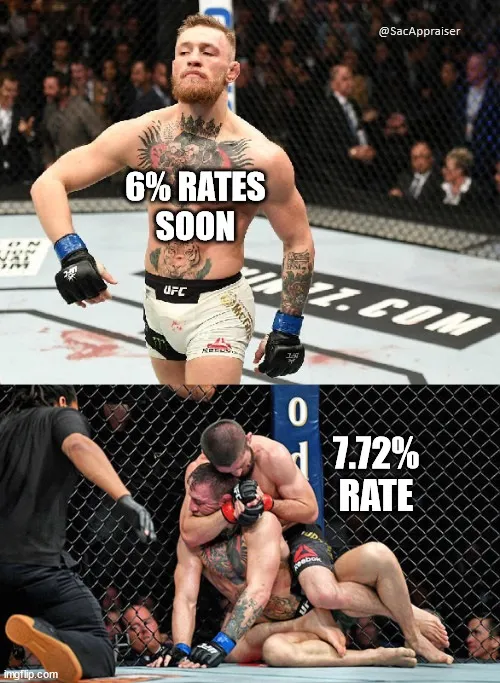
A couple new memes to show the sting of rising rates and how wrong so many predictions have been this year.
TEN TIMES MORE SUPPLY IN 2007
In September 2007 we reached the peak of housing supply in Sacramento County at 14.3 months. This means if nothing else came to the market, there would have been enough listings to satisfy demand for over fourteen months. In contrast, today we have about 1.4 months of supply. As I said a couple weeks ago when comparing 2007 and 2023, volume today feels very similar to 2007, but today inventory hasn’t been building like it did back then. That’s something that could change in the future, but it’s not the vibe right now.
SELLERS HAVE BEEN SITTING
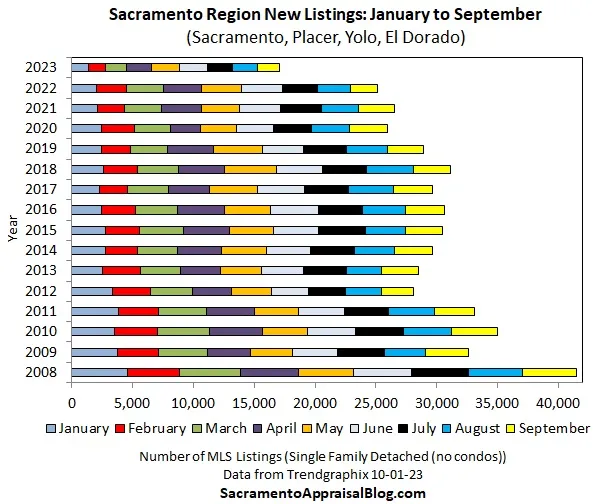
We’ve had about 8,000 fewer new listings compared to last year (a low year), and about 13,000 fewer compared to the pre-2020 normal. Lots of people online are talking about supply building, but that hasn’t been the case in Sacramento.
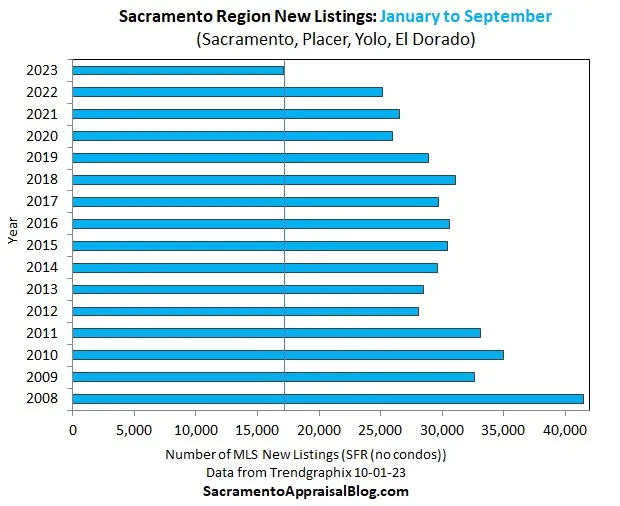
17,000 SELLERS HAVE LISTED SO FAR
About 17,000 sellers have listed this year (and closer to 18,200 if we add in condos). This number would be closer to 30,000 in a normal year, but normal isn’t what we have right now. It’s a market where many sellers and buyers are sitting. Yet, not everyone is sitting, and I have 17,000 data points to prove it.
ONE THING TO WATCH WITH 8% RATES
Rates are flirting with 8% right now, and one thing we could see is the pile of active listings grow if rates keep going up. Keep in mind this wouldn’t be growth in supply due to more sellers listing their homes. This would be the stack of active listings getting higher if buyers back off the market. In other words, an increase in supply by waning demand (fewer pendings). This is what happened during the second half of 2022, and it’s something we need to watch closely in coming weeks. We’ll know soon if 8% rates are an inflection point for buyer demand.
PRICES HAVE BEEN FLATTENING
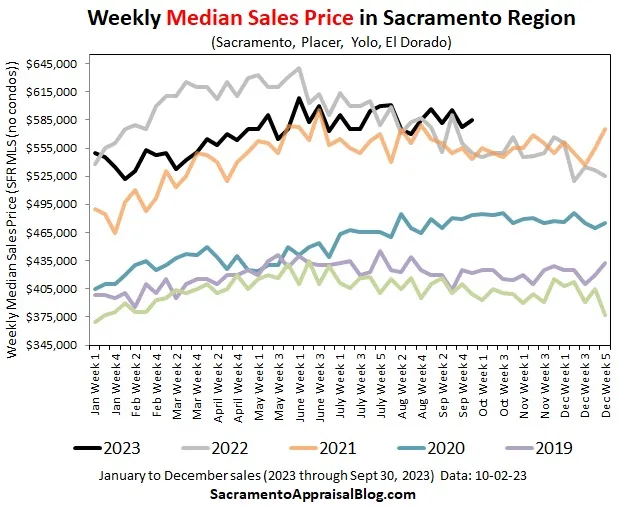
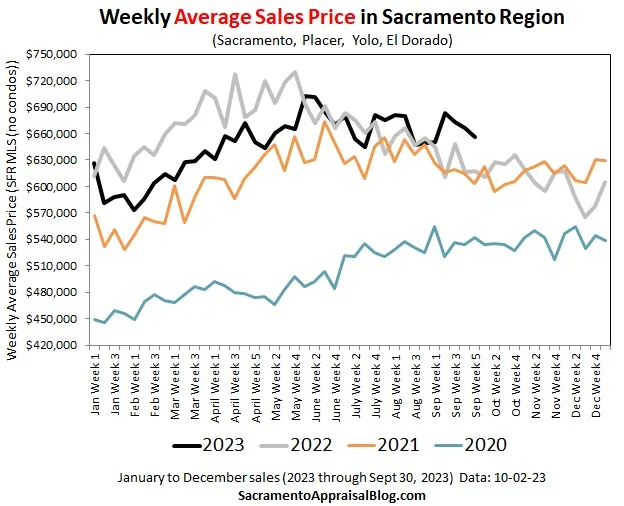
Last year we saw sharp downward price change, and it felt like the oxygen masks dropped from the ceiling during a crash landing. Today has felt more like a normal seasonal descent in terms of prices softening. That could change if rates keep spiking, but sharp change hasn’t been the description for 2023. We are starting to see prices higher than one year ago too.
WEEKLY PRICES
I like watching weekly prices because we get clues into what the monthly metric will look like. Do you see the flattening black line in 2023?
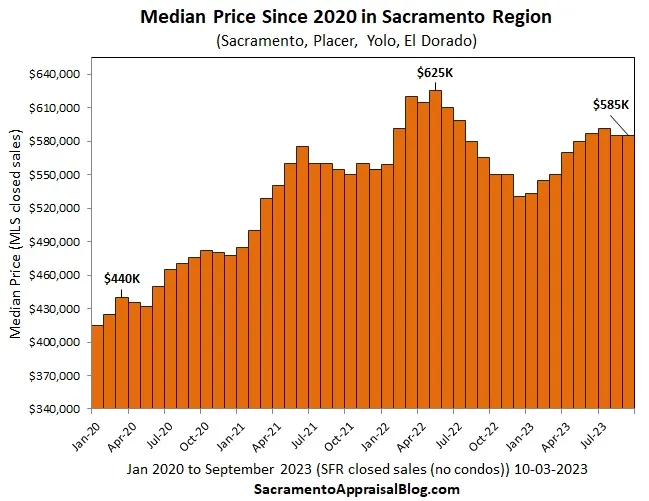
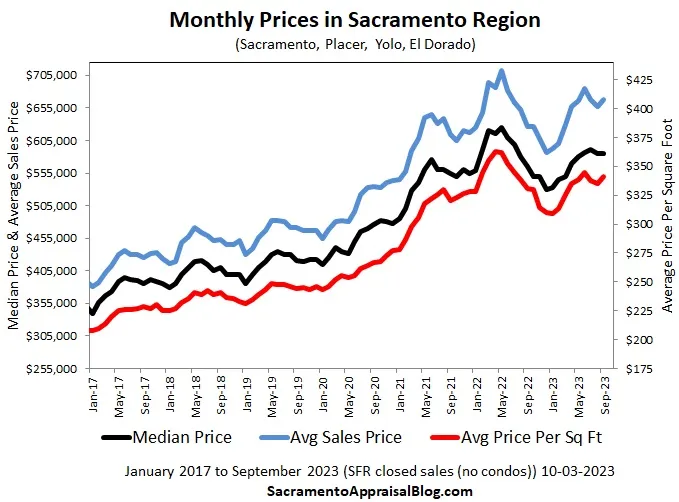
MONTHLY PRICES
It’s honestly a few days too early to share monthly prices, but I wanted to give a preview of the trend. Between August and September, prices were more flatter than not. Definitely not the sharp change we saw last year.
APPRAISER COLLEAGUES (ASKING AGAIN)
Earlier this year, I did a free webinar thingy on Zoom to talk about private work, and I’d be open to that again if there is demand. I’m starting to get the itch to bring some colleagues together, so let me know if you’d be interested. I got some good feedback last week, and I’d like to hear from some more too. This would be free. I’m not looking to make money on this.
Thanks for being here. I hope this was helpful.

